Climate Change Communication & the IPCC
It has been a while, but I am pleased to say that an essay that I contributed to (Climate change communications and the IPCC) along with a few colleagues at the IPCC, has just been published in the Journal Climate Change. One of a series of papers and essays looking at science communication – Climate Change Communication and the IPCC. A really important subject…
From the abstract…
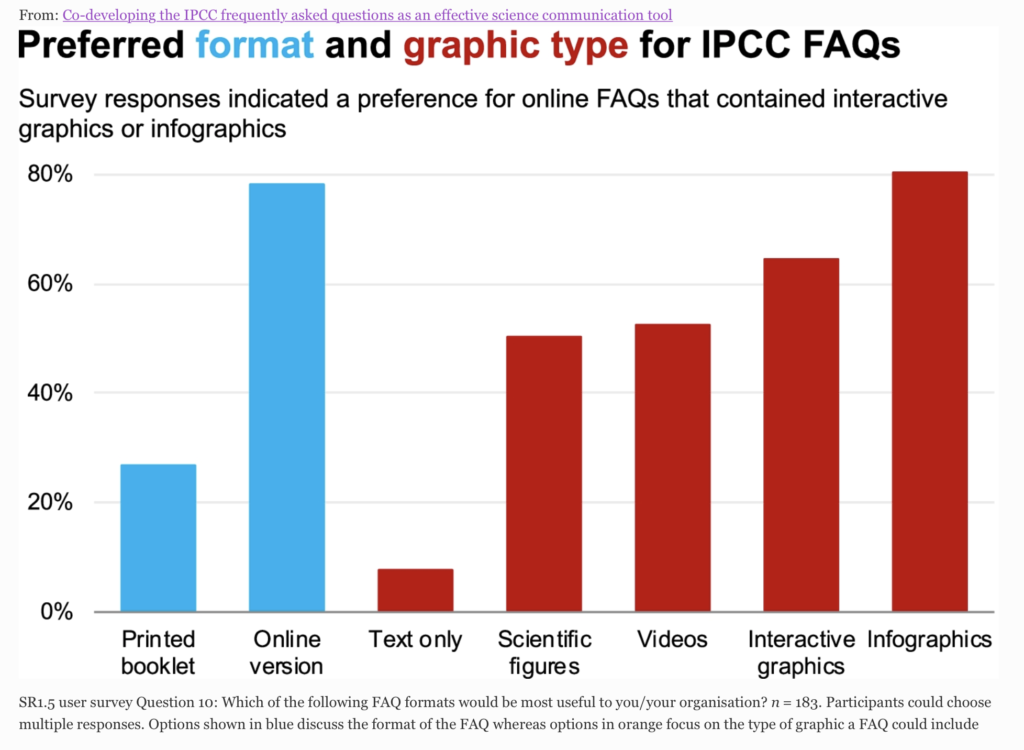
‘In its Sixth Assessment Report Cycle (AR6), the Intergovernmental Panel on Climate Change (IPCC) aims to strengthen the communication of its products. As the only mandatory part of IPCC reports specifically targeting a lay audience, the Frequently Asked Questions (FAQs) provide an opportunity for broader communication of key IPCC topics…
…we find that bringing together IPCC authors and communication specialists to jointly develop the text and graphics increases the accessibility and usefulness of the FAQs…
…we recommend involving communication experts from the beginning of the drafting process to share responsibility, which requires sufficient resources to be allocated to the FAQs…
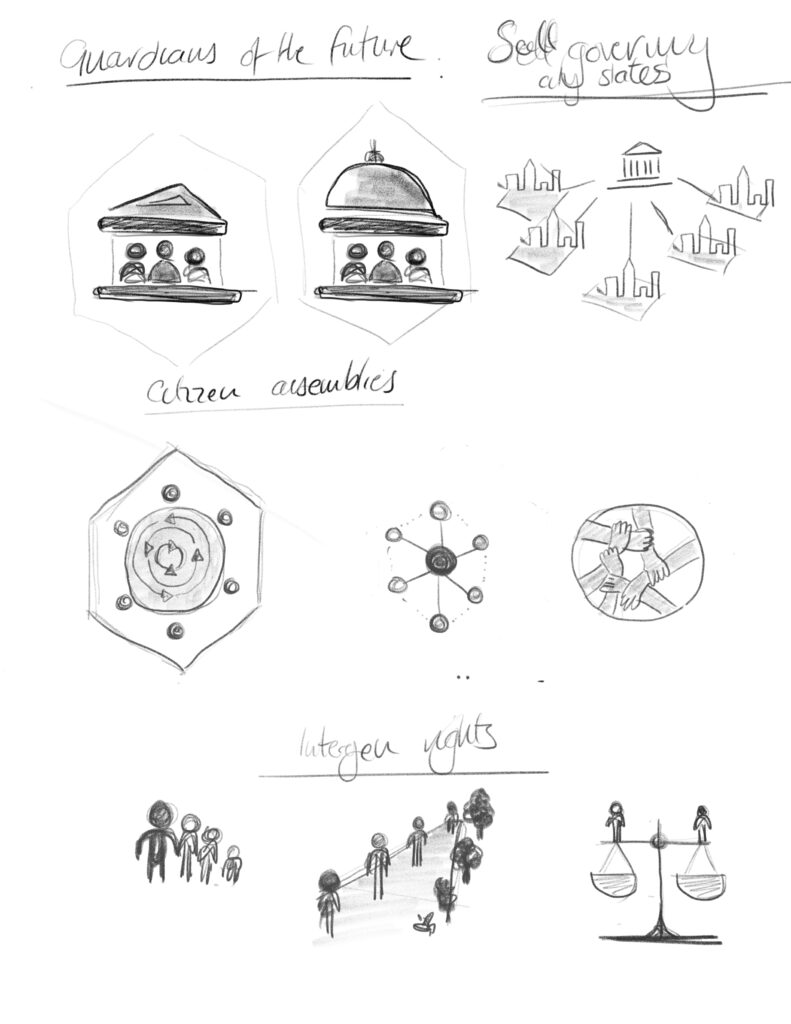
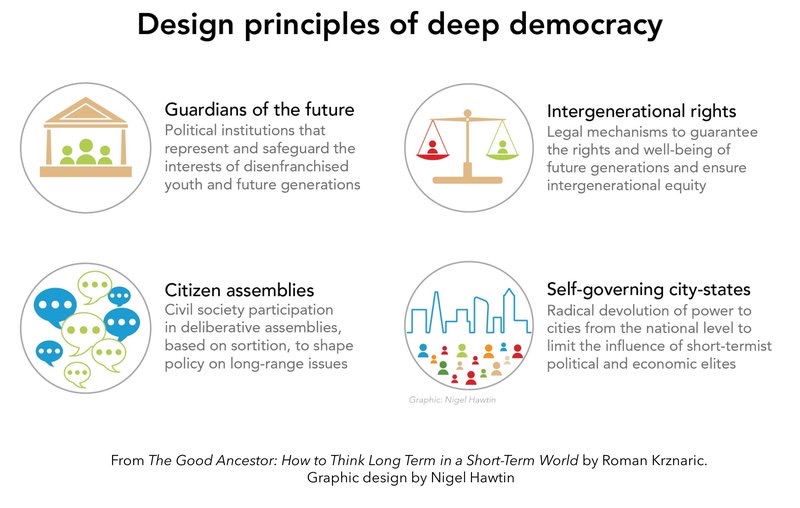
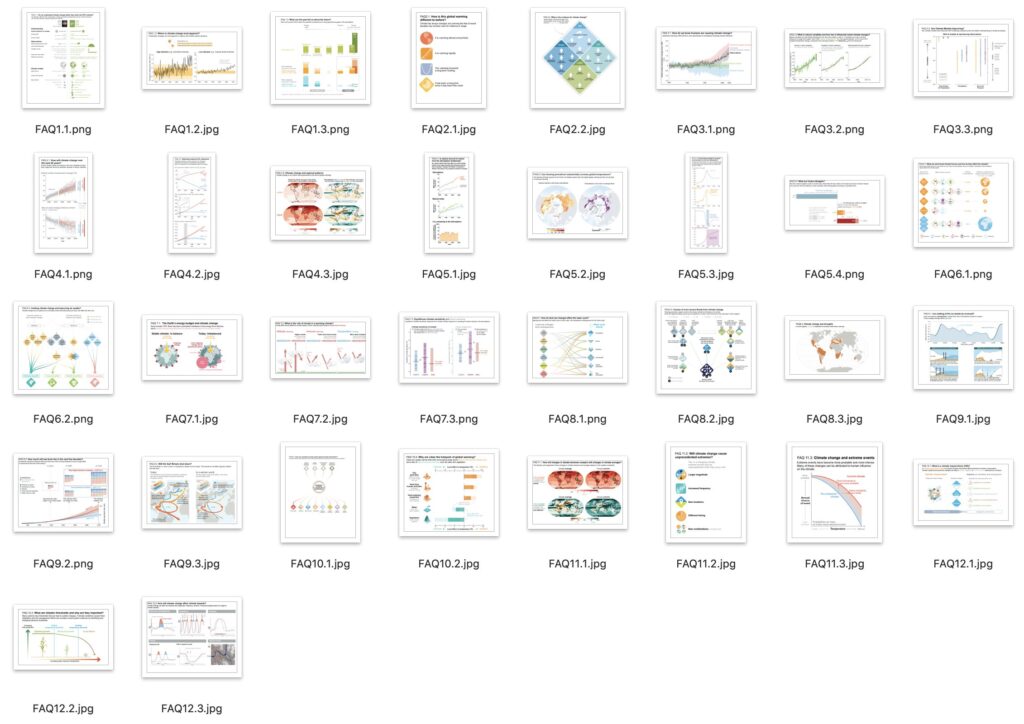
Enjoy reading along with the other papers and essays all looking at science communication. The report and all 32 FAQ graphics is here…
Many thanks to Sarah Connors, Sophie Berger, Malissa Walsh, Ros Pidcock and Maike Nicolai for putting up with all my questions and queries when producing the FAQs for the report.